
Published: 17 August 2026
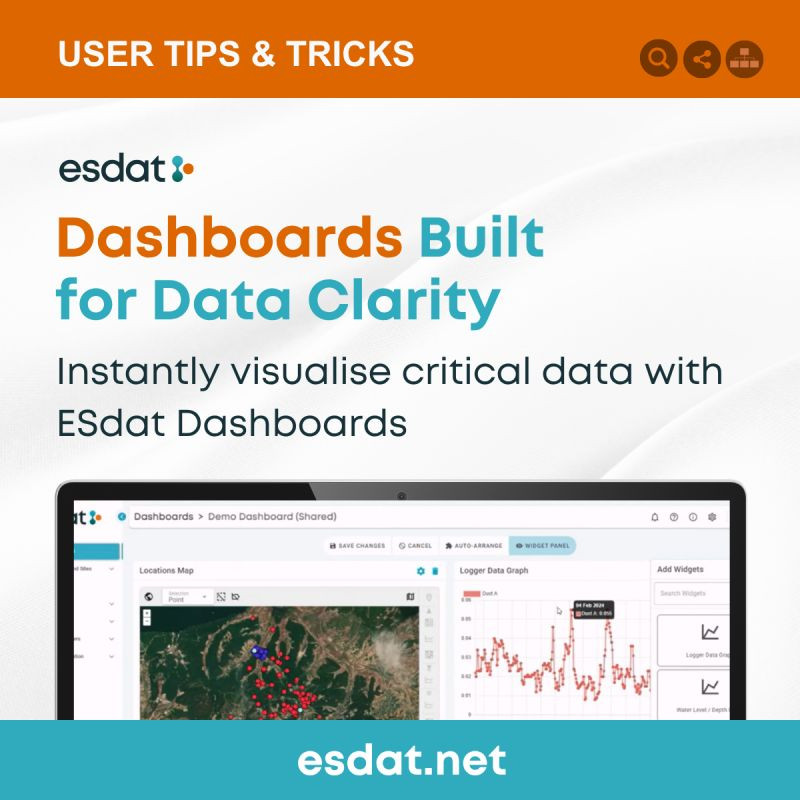
Did you know? You can build a fully personalized view of your data in ESdat, presented automatically every time you access the platform!
ESdat's Dashboard Functionality lets you configure your data with simple drag-and-drop tools, including interactive maps, live graphs, and exceedance alerts.
ESdat Dashboards bring the information that matters most into one configurable view. Users can arrange and resize maps, graphs, tables, notifications and other widgets, creating a practical overview that appears whenever they open ESdat.
An optional dashboard filter can update multiple widgets by project, site, or location—particularly useful for organizations managing several sites. From there, teams can explore locations on a map, monitor chemistry and logger trends, track groundwater levels and compare results with environmental standards.
Dashboards also support day-to-day operational oversight. Widgets can summarise laboratory report statuses, highlight recent field and laboratory exceedances, show active monitoring rounds and provide shortcuts to useful pages or external resources.
Each visual can be tailored to its purpose. Users can configure parameters such as time periods, locations, colors, legends, data aggregation, and non-detect handling. Together, these capabilities transform ESdat from a repository of environmental data into a focused workspace for monitoring conditions, identifying issues, and moving quickly to more detailed analysis.
Save time for you and your team by creating an automated dashboard for instant data insights. Find out how in our article: https://help.esdat.net/en/article/dashboards
Categories
Data Management
Keywords
Environmental Database, Data Management Software, Environmental Data Management